Process Mapping: 4 Great Examples
Mapping your business processes provides actionable, long-term efficiency.
Whether you're mapping out a process as part of an automation project or simply understanding how work gets done, these examples will help you get started.
Whether it’s a small startup or a worldwide enterprise, every organization needs established business processes to operate effectively. However, if you don’t clearly understand how your methods work, it will be hard to figure out where things are going wrong and where you can improve. For that reason, investing in business process mapping software is critical to keeping up with the intricacies of various workflows that support your organization.
What is Process Mapping?
A business process map outlines the functions required to complete a process. For example, your HR department may have process maps that cover onboarding a new employee into the company and ensuring they complete any necessary paperwork. Essentially, they're frameworks that visually represent how core functions work within your company.
Similarly, your Accounting department may have a particular way of processing invoices as part of a more extensive;AP/AR process that includes all the steps from receiving an invoice to logging it as paid in their Accounting software.
Having business process maps in place benefits your company in many ways, including:
- Removing any confusion about the state of your current business processes
- Allowing the department to follow a consistent blueprint for getting things done
- Helping you spot redundancies in different process steps
- Facilitating communications between business areas
- Helping you remain in compliance with the legislation applicable to your industry
There are several types of process maps, each with a unique view or application. Most business analysts start with a high-level process map and get more granular during interviews with each team member and use mapping tools to version and track their process maps over time to provide historical context. This is especially helpful with complex processes that need to show a high level of detail and identify areas across the organization that are involved.
Business Process Mapping Examples

The primary intent of process maps is to communicate how a process works. When you pick and apply the correct process map to specific business functions, you strengthen the understanding of your workers. Before we get into our business process mapping examples, let's look at common symbols often found within them.
Activity/Process
An activity or process represents a step or an activity within a process. A rectangle shape typically represents it.
Flow
The flow shape (sometimes called "process mapping symbols") is typically a line with an arrow on the end. A flow highlights the sequence of execution within a process for the viewer.
Event
An event is what starts, changes, or finishes a process. The events you might want to make visible include errors, messages, cancellations, or links. Events are represented by a circle that contains other symbols depending on the event type.
Decision
The decision shape, represented by a diamond, indicates that the process must decide moving forward. It can be a binary yes/no decision or something more complex with multiple choices, like a case statement in a computer program. You should try and capture all options that might impact a process's flow.
The above shapes are commonly found within business process mapping examples.

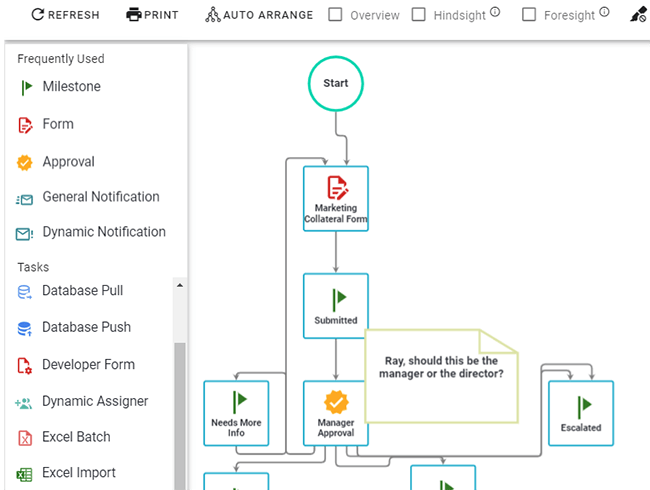
1. Flowchart
Flowcharts are the most basic type of process flow. It contains symbols that outline the flow of steps within a process in sequential order. One of the biggest benefits of flowcharts is that you can adapt them to fit pretty much any function, like manufacturing, administration, or even project planning.
The best time to use a flowchart is when you want to provide an easy-to-understand example of how a process works. Flowcharts make spotting where you want to change or improve processes is easy. In addition, it’s easier for non-technical users to understand flowcharts versus other business mapping examples.
When creating a flowchart, you should:
- Focus on making the process transparent versus making it look perfect
- Capture the key personnel involved in a process, like customers and vendors
- Get the input of individuals involved in completing a process within the business

2. Swimlane
Swimlane process maps are similar to flowcharts in that they visually map out the steps of a process. The most significant difference between the two is that swim lane maps line up in lanes that let the viewer know who’s responsible for completing each step, like a department or automation process.
Here’s what to keep in mind when putting together a swimlane process map:
- Where are you getting your information from?
- Is there anything that might interrupt the swimlane flow?
- Does a task need to be assigned to a different person, department, or process?
- Will you need to wait for a decision from someone else before moving to the next step?
- Will the process require data input to keep the process going?
- Will you need to transform the input to a different format?
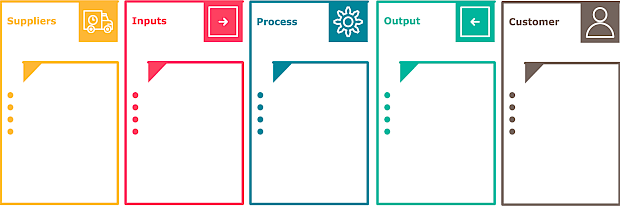
3. SIPOC
The SIPOC process map is used to outline the intent of a process along with the key players involved. The acronym SIPOC stands for:
- Supplier — The person or organization providing input to the process.
- Input — The resource that the supplier adds to the process.
- Process — The series of steps involved in converting input into output.
- Output — The resource produced by the process.
- Customer — The person or entity that receives the output.
SIPOC process maps typically consist of six to eight total steps. It’s an ideal tool for project managers who must provide a high-level view of the functions involved in a process. A SIPOC diagram should convey:
- The start and end of the process
- Those affected by the process
- What goes into the process
- The steps involved in completing the process
Creating a SIPOC business process map shows stakeholders the information they need about each step and any dependencies.
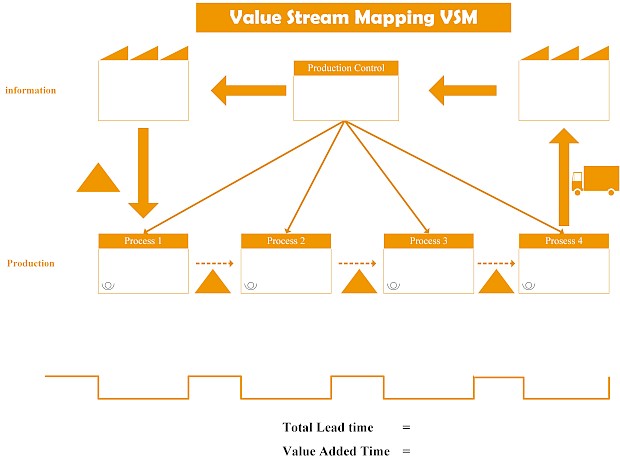
4. Value Stream Map
A value stream map (VSM) is a detailed flowchart that documents the individual steps within a process along with the information flow and related data inputs. It may be easier to think of it as a more detailed SIPOC process map. VSMs are useful when you need to show how you can add value to a current process by making functional changes.
VSMs are great for locating and eliminating redundant steps within a business process. For example, you may want to create a VSM of a process’s current state and then create a future state VSM that shows how it would work with your proposed improvements.
Create Better Business Mapping Process Flows
The flexibility and power of Integrify's workflow builder support your need to create different types of process flows. The drag-and-drop tools let you build custom workflows that help you quickly develop the process maps needed to help you increase efficiency throughout your organization.
Contact Integrify today for a demo of our workflow builder.

Map and Automate Any Business Process
To see how quickly you can begin automating your business processes, check out our 2-minute product video.


![]()