Workflow Diagrams and Charts
What is a Workflow Diagram and How Are They Produced?
What is a workflow?
Let us start by defining what we mean by "a workflow". There are several definitions on the web, but for our purpose, we have chosen a simple dictionary definition of a workflow as being:
‘The sequence of industrial, administrative, or other processes through which a piece of work passes from initiation to completion.’
From this definition, we can identify that three parameters further describe each workflow diagram's component or step:
- Input
- Transformation
- Output
The workflow must be performed by someone or something, termed resources such as people, machines, or software. It is the resources that make the workflow happen.
A business workflow is a repeatable process consisting of tasks that must be completed in a specific sequence. Think of it as work flowing from one stage to the next until it is finished. Workflows help ensure that essential processes are done the right way every time. A good example is the assembly of a motor car. The parts are added to the vehicle's chassis in sequential stages, such as counting the engine and transmission, the bodywork, the seats, interior fittings, and the wheels until the finished car rolls off the assembly line.
What is a workflow diagram?
A workflow diagram, sometimes called a workflow chart, is a visual representation of a business process (or workflow), usually done through a flowchart. It is a visual way for business analysis to show how work gets accomplished. Workflows are symbols that show how various workers perform tasks and interact with each other and how information (data) flows through the business area. It may also identify individual responsibility for each step in the process.
Workflows can also be documented by numbered sequential steps or in a checklist form. This method is well suited for detailing a specific task or activity or a simple sub-process. However, it is unsuitable for a complicated process where parallel action or decision points may be multiple outputs or sub-processes for the complete (end-to-end) process cycle.
Workflow diagrams are often created to document and share a process, improve the process for workflow analysis, or prepare a process for automation.
As the adage goes, "a picture paints a thousand words." This concept applies to workflow diagrams and workflow charts to provide a visual representation or overview of a business process.
The origins of workflows can be traced back to Henry Gantt. Yes, the same person is responsible for the Gantt chart. The Industrial Revolution catalyzed intelligent thinkers like Gantt to develop efficient ways of organizing a workforce.
Workflow Diagram Examples
Numerous types of diagrams are used to visualize the workflow. Some of these diagrams have been around long and come in wide varieties. Let's look at some examples of workflow diagrams. Some of the most popular ones are:
- ANSI flowchart: This style grew out of flowcharting in the 1970s and became the first workflow standard. The symbols came from the American National Standards Institute (ANSI). Many people still use the symbols today, often to show accomplished work. For example, an ANSI flowchart may show how an employee's payroll is calculated, processed, and approved for payment.
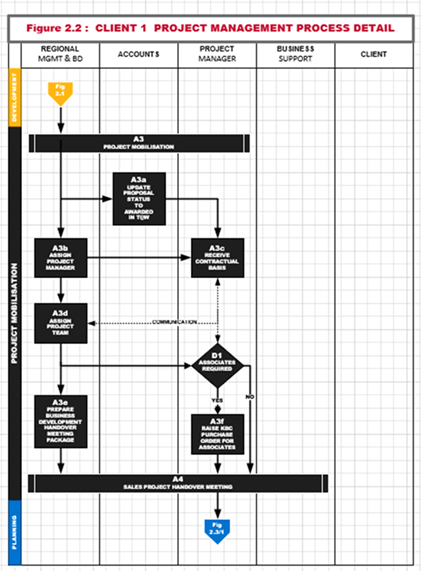
- Swimlane: A swim lane diagram is a flowchart delineating who does what in a process. Using the metaphor of lanes in a pool, a swim lane diagram clarifies accountability by placing process steps within the horizontal or vertical “swim lanes” of a particular employee, workgroup, or department. This workflow diagram focuses on interactions between organizational units and can expose bottlenecks and process inefficiencies.
- UML Activity: This diagram arose from UML (Unified Modelling Language). It operates like a flowchart and shows different steps, ordered tasks, and control flow.
- BPMN: Business Process Modelling Notation (BPMN) is a standard created for business rather than application development. In other words, it focuses on graphically presenting business processes and information rather than solutions.
- IDEF Diagram: IDEF (Integrated Definition) is a graphical technique used in process simulation to apply processes and engineering applications. The United States Air Force first conceived IDEF and further developed in the mid-1970s. It was developed as a primary tool for recording and evaluating business processes. This technique is a rigid framework for studying an organization, capturing “as-is” process models and business operations simulation.
- SSD Flowchart: The Structured Systems Design approach is process-oriented, aiming to break a complex project into a series of smaller, more manageable modules or functions.
- Geographic diagrams: These diagrams are commonly used in warehousing and logistics to show objects' placement concerning workers. For example, a geographic diagram would mandate that the most commonly ordered products be placed closest to the shipping station. The least-commonly ordered products are placed farthest from the shipping dock and highest on the racks.
- SIPOC: SIPOC stands for "Supplier–Input–Process–Output–Customer." Used primarily in Six Sigma, this diagram shows who creates the data, details the high-level process and depicts who receives it.
- Data Flow Diagram: This type of chart shows the flow of data between the different entities and data stored in a system, while a flow chart shows the steps involved in carrying out a task. In a sense, the data flow diagram provides a very high-level view of the system. System developers, rather than process analysts, use these.
Listed below are common workflow diagram examples of some of these flowcharts:
An example of an ANSI Type workflow chart with SSD elements is shown.
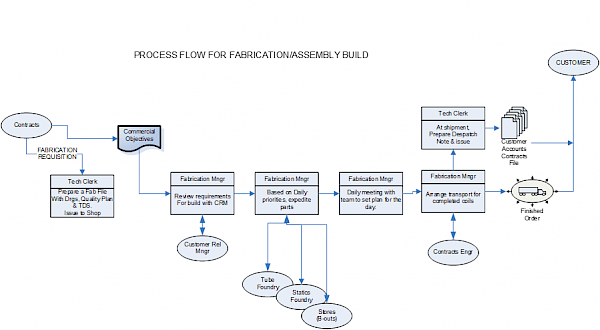
A high-level process flow using ANSI standardized symbols.
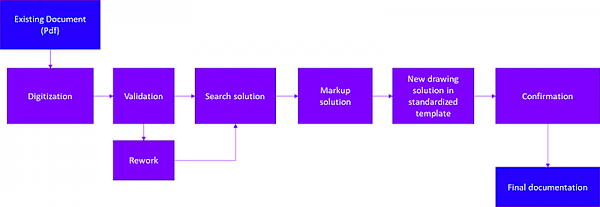
An example of a swim lane workflow diagram in a horizontal layout style.
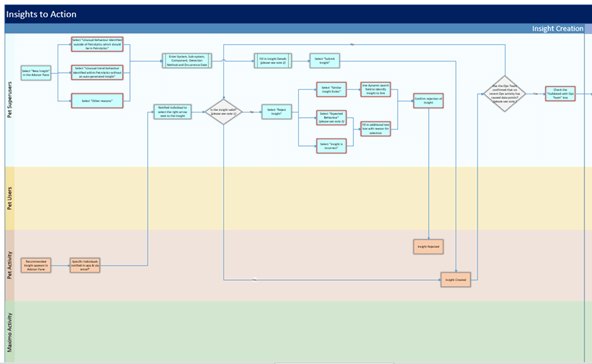
An example of a swim lane workflow diagram in a vertical layout style.
Example of BPMN Type workflow chart.
Example of IDEF Workflow Diagram.

Why not create your workflow diagram and then use it to automate your processes?
You can do it in Integrify.
What are the benefits of a Workflow Diagram?
Workflow diagrams and workflow charts provide an easy visual way to document and analyze a business process or sub-process.
A workflow diagram demonstrates all the significant steps of a process or business unit. It helps you understand the big picture and relationships between different actions and work functions, locates critical stages of the process or business unit, and identifies potential improvement opportunities.
Some of the benefits of workflow and process diagrams are:
Improved communication
Using workflow charts and other flowcharts as part of process documentation empowers entire teams to collaborate as they create, edit and analyze their processes using flowcharts.
Studies have shown that communication in the workplace is critical because it affects every aspect of the company. Flowcharts provide a tool for communicating and visibility of the organization's processes.
Communication using flowcharts makes day-to-day operations smoother with clear responsibility lines, leading to fewer errors, a better-informed workforce, and reduced employee turnover.
Documentation
A key team member leaves, and suddenly, the process no longer works. In many organizations, the processes are only reviewed or analyzed when problems arise or the process has become cumbersome or no longer working effectively.
Documentation of the process avoids these pain points as newcomers can be inducted into the position with a run-through of the existing process documentation.
The documentation can also provide awareness of the organization's big picture, which includes who does what and where a particular role fits the overall process.
Finally, documentation provides a quality assurance process to ensure optimum products or services are offered to your customers or clients.
Capability for practical analysis of the process leading to improvement opportunities.
Precise and up-to-date documentation of the current processes allows problem-solving when things do not run smoothly or when an analysis is required due to a change of policy, circumstances, or application of new technologies.
Unfortunately, because a business evolves, unnecessary and redundant tasks creep into the work practices that take place daily. Once you have more insights into your processes, you can determine what activities are essential while identifying and eliminating redundant, non-value-adding tasks and activities. This, of course, has countless benefits and creates value for your business.
Provide better customer service.
We all know that without our customers, there is no business.
So, it is essential to constantly find ways to align our processes to the customers' needs. After all, we are all in business to satisfy our customers and clients. Unfortunately, customer requests or complaints can be easily overlooked when relying on people remembering the process. Customer feedback and complaints management are key in the process evaluation.
It provides an opportunity to become more efficient and increase profitability.
Mapping out your processes in a workflow allows you to get a more precise, top-level view of your business. Even if you have a well-established set of business processes, do you know if they deliver results? Are the processes as good as they could be? Consider how your business might benefit from following proven workflow diagram examples to streamline and optimize all your varied processes. Time is money, and efficient workflows save you time.
One of the biggest reasons workflow is essential is because it gives you greater insight into your processes. Using the insights from the workflows allows one to become efficient and improve the bottom line.
How do I create a workflow chart?
The famous process expert Edwards Deming once said, "If you can't describe what you are doing as a process, you don't know what you are doing." That quote merits some further discussion. What does it mean to describe what you are doing as a process?
Typically, workflow diagrams are created during the process discovery phase of a project, where the first step is to map out the existing processes. In the process of mapping, we need to conduct the following activities:
- Conduct a series of workshops with a cross-section of staff from the existing process's current owners, users, and approvers. The objective of these workshops will be to map out the current process. A number of these workshops may be required to document the critical process and its variations entirely.
- Follow-up one-to-one meetings, as required for:
- Variations, deviations, and possible bottlenecks
- further data collection, such as lead times
- Understanding of existing technology applications
- The purpose of approvals is to identify the input of critical skills.
- Develop the current process document and the variations to the primary process. Ensure that buy-in/agreement is obtained from the participants.
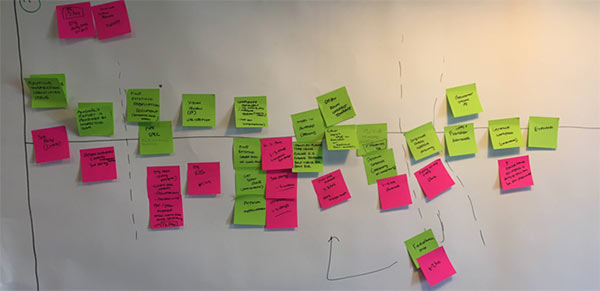
From the process mapping activities, we can create workflow diagrams for the processes.
To develop each workflow diagram, the following step-by-step approach is helpful:
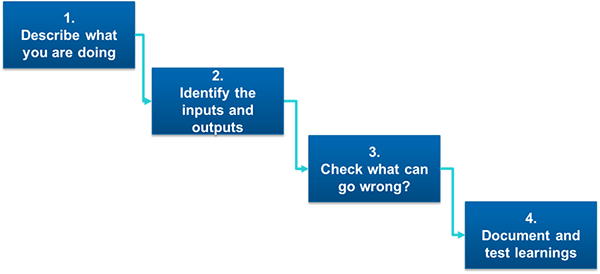
- Describe what you are doing in a series of steps. Perhaps the most self-evident element of a process is the sequence. Something comes first, something else comes second, and so on. If some order appeals to you, that structure tells you about the activity as a process.
- Identify the inputs and outputs. Every process requires something that goes into it, whether raw materials, information, or energy. Every process generates products and sometimes by-products, which may come at the end or anywhere during process execution.
- Determine what usually goes wrong. It might seem like looking for failures is the opposite of process-oriented thinking, but you must have experience with the process if you know what mistakes commonly crop up. This can also point to areas where more details may be required.
- Document what you learned and test it with someone else. Once you have described what you are doing as a process, give your process documentation to someone else and see how they do it. Typically, one of the key players from the user group (people working in the process) can be very useful for this feedback loop to ensure that you have documented what happens.
Specialist flowcharting software is not a prerequisite for developing workflow diagrams. It is sometimes better to keep things simple and use sticky notes on a board to elicit information from those working. Once the information has been gathered, analysts can use the software to produce the visuals. An abundant array of tools is available, from office productivity tools such as MS Office. Yes, MS Word, Excel, and PowerPoint have charting capabilities. Another popular tool specifically for creating workflows and charts is MS Visio. These have sufficient capability for almost all workflow diagram creation for standalone usage.
All the BPM software products also have workflow diagramming capability. The benefits of using the built-in capability are that they can then be used to analyze and move to full process automation.
Examples of Tools for Creating Workflow Diagrams
How do I automate a workflow?
An automated workflow identifies tasks performed by employees and automates them with tools, apps, and technology.
A host of tasks consume time and are repetitive in any organization. Examples include lead management, data input, follow-up emails, human resource management and marketing. Switching a manual task to a self-operating workflow process saves your business money and removes the risk of human error when set up correctly.
There are several drivers for adopting workflow automation. Some of the most common include:
- Efficiency
- Data and task accuracy
- Productivity
Business processes in various business functions can be automated, including marketing, finance, human resource management, and operations, by applying automated workflows.
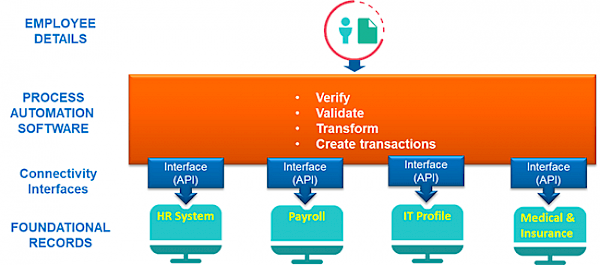
The best way to illustrate automating a workflow is to take an example. Consider the onboarding process for a new employee in an HR function.
When a new hire comes on board, a team member must manually input all their details into the company’s systems and records. The list can be vast: personal information, tax details, addresses, payroll details, skills & competency details. Other people may also enter this information into the organization into medical & insurance records, expense accounts, and many more. The same or similar data is entered into several records and systems by different people, with lots of room for human errors.
By automating this workflow, your company can free up time for the employees tasked with inputting all this data and ensure your database record is a lot more accurate, creating a single source of truth. (The same data populating the array of records).
Workflow automation software allows you to do this by understanding your current processes, using the workflow diagrams, and creating a future state process that is automated by the software. I.e., You create routines, rules, and logic in the automation software to take your new hire data and populate all your systems automatically.
This is shown in the workflow diagram below:
By correctly implementing automation of this onboarding process, we can:
- Improve productivity due to quick processing and data sharing
- Cut storage/printing costs that come along with paper-based HR processes.
- Make sure the company remains compliant with policies and procedures.
- Boost your company’s growth through more efficient hiring. i.e., less time spent onboarding a new hire
- Provide time to analyze the HR processes and seek further opportunities for improvement.
From this automation approach, we can see that applying automation in the business is endless. Business process automation software products are developing at an incredible pace. Many products come with pre-built automation routines based on best practices that can be tailored to any newcomer. These routines cover many business functions, including HR, finance, sales, marketing, operations, maintenance, and supply chain. This is speeding up the uptake of automation software.
If you have not considered automating your processes, please visit our Resources page to learn more about workflow automation.
Interested in Automating Your Workflow?
We have various resources to help you navigate an automated workflow.
Go Beyond Diagrams: Automate Your Workflow
To see how quickly you can begin diagramming and then automating your processes, request a demonstration or trial of Integrify.
Additional Process Design Resources
- How to Write Process Documentation
- 5 Ways to Avoid Risk in Process Automation Projects
- What is Process Discovery?
- Workflow Metrics and KPIs Explained
- 5 Ways to Ensure Bad Workflow


